
🕰️Critical Time Windows Today (UTC – New York)
(This article focuses on analyzing gold (XAU/USD) buying opportunities and upward/downward trend movements)⚠️

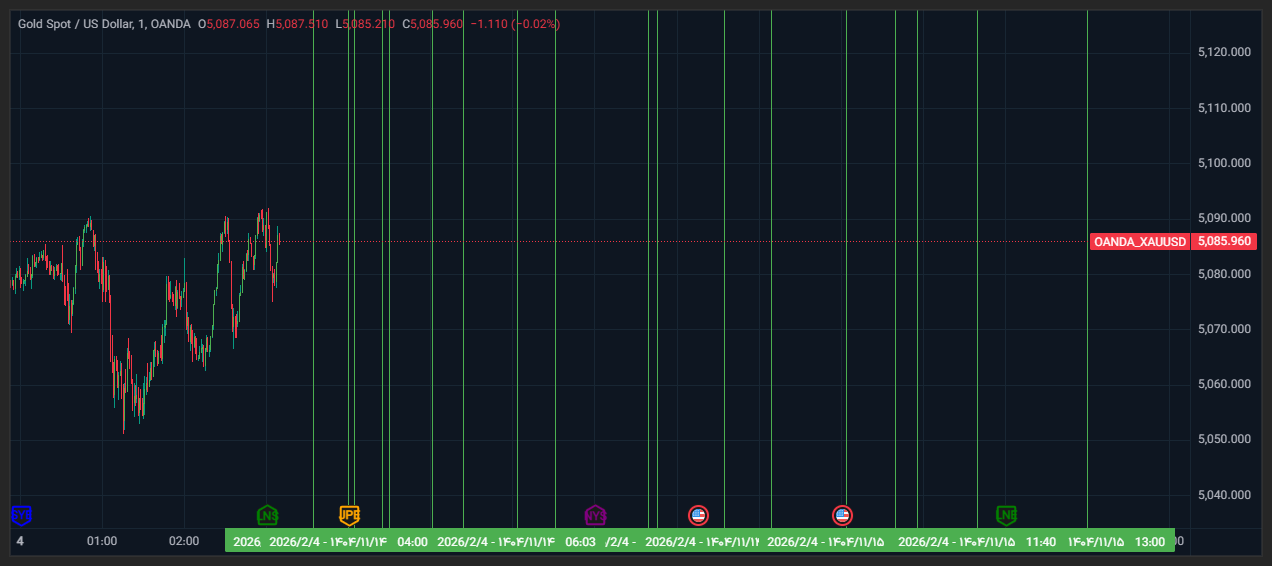
Critical Time Windows Today (UTC – New York)
(Time frame considered: 1 minute, suitable for scalping)
| Time | Description |
|---|---|
| 04:00 – 04:04 | First potential direction change |
| 04:25 – 04:30 | Predicted market reaction |
| 05:01 | Next opportunity for trend shift |
| 05:24 | Analyzing upward or downward trend |
| 06:03 | Short-term market reactions |
| 06:31 | Critical point for trend analysis |
| 07:39 – 07:46 | Critical window for market movement |
| 08:35 | Next possible price trend |
| 09:09 | Moment for possible trend change |
| 10:03 | Review of support and resistance levels |
| 10:40 – 10:56 | Key decision-making moments in the market |
| 11:40 | Final market trend analysis |
| 12:58 | End of day market analysis |

This time frame of 1 minute is ideal for scalping as it allows for quick market reactions and shorter-term trades
Today’s High and Low Prices
| High Price | Low Price |
|---|---|
| 5266.5 | 4986.4 |
| 5230.2 | 5021.7 |
| 5190.2 | 5057.2 |
| 5164.5 | 5092.8 |
Note on Time, Support, and Resistance:
In time-based analysis, the critical time windows set for the gold market help us identify key turning points. Since this article is designed for scalping, precise timing is crucial. Additionally, in volatile markets, identifying support and resistance levels can provide good entry and exit points for short-term trades.
-
Support: Typically found at lower price levels (such as 4986.4 and 5021.7), where the price may potentially reverse.
-
Resistance: Found at higher price levels (such as 5266.5 and 5230.2), where the price may struggle to break through and could face a pullback.
Consider these levels to capitalize on the fast-paced market movements

Leave a Reply